
DutchBros Coffee - Brewing Growth
I. Investment Thesis & Key Drivers
I am recommending Dutch Bros (BROS) LONG with a 12-month price target of $82 (+43% upside). The market is anchoring on the wrong data — debating whether east coast unit economics will hold while management has already disclosed that they do (~$1.7M new market AUVs vs. ~$1.7M legacy PNW AUVs; 2024 cohort year-one sales 20% above the 2023 cohort). At ~28x forward EV/EBITDA, BROS trades at a ~35% discount to its own three-year average and a 25% + discount to CAVA — the closest contemporary fast-casual hyper-grower — despite a longer unit growth runway, leading store-level ROIC, and superior contribution margins. The five drivers below explain why I believe consensus EBITDA estimates and the multiple are simultaneously too low.
■ (1) The east coast portability question is empirically resolved. This was the central pillar of the short thesis throughout 2024. Management disclosed in Q1 2025 that AUVs in Florida, Tennessee, and Kentucky are tracking ~$1.7M — on par with Pacific Northwest legacy markets. More compelling is the 2024 vintage cohort: those stores delivered first-year sales 20% above the 2023 cohort, the opposite of what a brand-awareness-constrained model would produce. The Downtown LA walk-up-only store, opened November 2025, immediately became the system's #1-performing location with a mobile order mix 3x the system average. The thesis that 'people in Charlotte don't know what Dutch Bros is' has been falsified by the data, but the multiple has not yet absorbed this.
■ (2) Five quarters of traffic-led SSS in a structurally challenged macro is rare and underappreciated. Q3 2025 system SSS of +5.7% was driven by +4.7% transactions — the fifth straight quarter of positive traffic growth. For context, Starbucks transactions fell 4% in the same period, and McDonald's US comps are tracking flat-to-negative. Traffic-led comps are the highest quality form because they reflect genuine demand expansion, not price increases consumers may eventually reject. This signals BROS is taking share, not riding a cyclical wave.
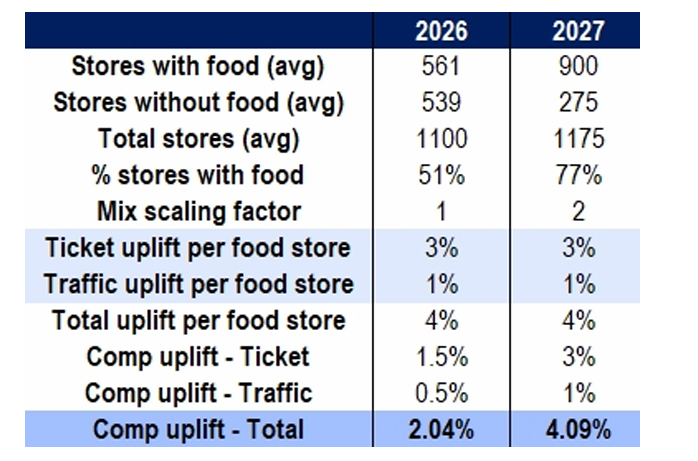
■ (3) Food is a 2026-2027 SSS re-acceleration catalyst that consensus is treating as neutral. BROS's morning daypart sits at ~33% of sales vs. ~50% for QSR peers — a structural revenue gap that food (eight items now in pilot: wraps, breakfast sandwiches, muffins, waffles) is designed to close. Pilot stores (300+ at year-end 2025, system-wide by end-2026) showed a ~4% comparable sales lift. If nationwide rollout achieves even half that lift on full-system implementation, system SSS reaccelerates from a 3-5% guide back to 6%+ in 2027. Food attach also extends loyalty engagement (currently 72% of transactions are app-based) by giving customers a daily reason to re-engage rather than an afternoon-energy occasion.
■ (4) Capex per unit has fallen from $1.8M to $1.3M — a 28% improvement that compounds the unit economic story. Management's shift to build-to-suit lease arrangements (15% of leases in 2024 → 40% in 2025 → 60% target) has driven capex per unit down from $1.8M peak to $1.3M as of Q4 2025. Combined with the existing real estate cost advantage (~950 SF average vs. 2,411 SF for Starbucks; estimated 40-50% lower rent per unit), this raises new-unit cash-on-cash returns from a 35-40% range to a target of 45%. Higher returns at lower capex is the most important structural change of 2025 and the primary reason BROS is now FCF-positive ($54M FY25) — yet the multiple is still pricing in legacy capital intensity.
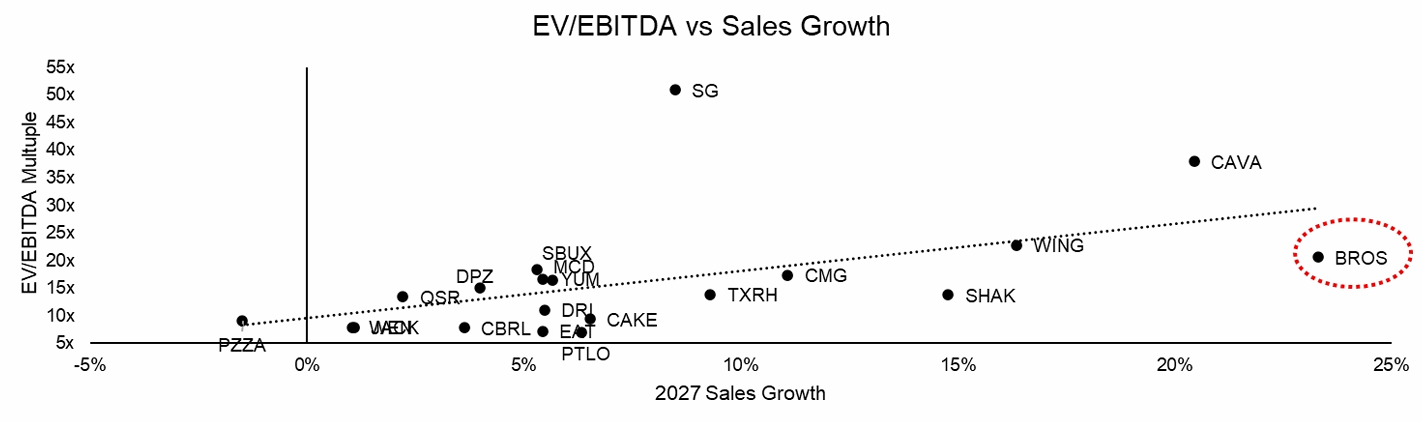
■ (5) The valuation gap is the largest the stock has shown since IPO and is set to compress. BROS trades at ~28x forward EV/EBITDA versus a 3-year average of 44x, while EBITDA growth is accelerating (+31% in 2025; guide implies +20% in 2026). On a growth-adjusted basis (Section IV regression), BROS trades 12-14x below the implied multiple given its 2027 sales growth — the largest residual in the QSR universe. Refranchising optionality, which management has not formally guided to, is a free option layered on top: if BROS pursues a McDonald's-style refranchising model post-2030, the asset-light re-rating could add 5-8 turns of EV/EBITDA.
II. Business & Industry Dynamics Business model:
BROS operates 1,136 drive-thru-only kiosks across 25 states (~70% company-operated, generating 92.7% of revenue). The product mix is differentiated: ~50% espresso-based coffee, ~25% proprietary Blue Rebel energy drinks, ~25% non-coffee (teas, lemonades, boba, smoothies). AUV of $2.1M from ~950 SF outpaces Starbucks' $1.8M AUV from 2,411 SF — among the best sales-per-square-foot economics in the QSR sector.
The model is built on three legs: (i) high-throughput drive-thrus designed for speed; (ii) a culture of made-to-order customization (literally hundreds of Rebel/coffee combinations) that creates emotional engagement and low customer churn; (iii) an internal-only operator pipeline (475 candidates, ~7-year average tenure) that preserves the 'broista' service culture as the company scales. How the industry monetizes: QSR beverage chains earn through transaction frequency (coffee is a daily ritual), pricing power on customization, and morning daypart dominance. Margin structure is dominated by three line items: beverage COGS at 25-30% of revenue (with dairy ~30% of basket and coffee only ~10%, contrary to common assumption), labor at ~28-30%, and occupancy at 4-10% depending on real estate strategy. BROS's structural advantages flow through every line: proprietary Rebel removes third-party energy drink margin; small-format real estate cuts occupancy by 400-600bps vs. Starbucks; drive-thru-only model has lower labor complexity (no bussing, no dining room management).
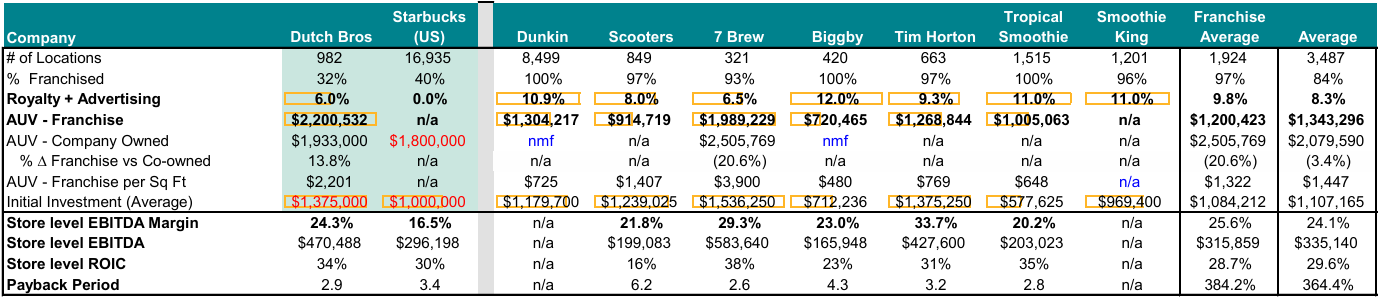
■ Smaller store footprint with industry-leading sales per SF. At ~950 SF average vs. 2,411 SF for Starbucks, BROS pays an estimated 40-50% less per unit in occupancy while generating $2.1M AUV vs. SBUX's $1.8M. Sales per square foot of ~$2,201 is the highest in the franchised coffee peer group — 3x Dunkin' ($725), 1.5x Scooter's ($1,407), 1.1x 7 Brew ($1,989). Real estate efficiency is the single most durable structural moat in the model.
■ Best-in-class store-level ROIC and cash-on-cash returns. Store-level ROIC of 34% leads the franchised coffee peer set (peer avg. 28.7%), with a 2.9-year payback period vs. peer median of ~4.3 years. Store-level EBITDA margin of 24.3% exceeds Starbucks (16.5%), Scooter's (21.8%), Biggby (23.0%), and Tropical Smoothie (20.2%). These are franchise-disclosure-quality numbers from 2025 FDDs — they validate that BROS's economics are best-in-class even before factoring in the 2025 capex/unit reduction.
■ Differentiated product mix and continuous innovation. The 50% coffee / 25% energy / 25% non-coffee split is unique in US QSR — no peer has the same balance. Proprietary Blue Rebel (the energy line) has no third-party royalty drag (vs. resellers of Red Bull/Monster), captures full vertical margin, and gives BROS a category most peers cannot easily enter. Hundreds of Rebel/coffee combinations create an emotional 'my drink' relationship — customers customize identity through orders, which is operationally hard to replicate at scale.
■ Gen Z brand momentum and loyalty depth. 72% of transactions flow through Dutch Rewards (15M+ members), highest loyalty penetration in the coffee category (vs. ~30% at Starbucks, ~15% at Dunkin'). The brand has cult-like Gen Z affinity — TikTok organic content, secret menu virality, and 'Dutch Mafia' fanbase are operating-leverage assets that don't show up in financials. This is the category-defining brand momentum that took Chipotle a decade to build.
■ Newness as a structural advantage. With 1,136 stores in a 7,000+ store TAM, BROS is in the early innings of national awareness. Each new market opening is a brand-discovery event for that region, generating earned media and social engagement that mature concepts cannot replicate. New-market AUVs at ~$1.7M (matching legacy PNW) prove the brand travels. The 'newness' tailwind compounds for the next 5-7 years of expansion.
III. Valuation — Growth-Adjusted Framework & Price Target
The most direct way to evaluate BROS's valuation is on a growth-adjusted basis: regress EV/EBITDA against forward sales growth across the QSR universe and identify where BROS sits relative to the implied multiple. The result is the largest negative residual in the entire QSR universe, trading roughly 12-14x below where its growth profile would predict. EV/EBITDA vs. 2027 Sales Growth — BROS sits well below the QSR regression line Read-through from the regression: Industry peers cluster tightly along a positive-sloped line — higher growth commands a higher multiple. CAVA, WING, CMG, SHAK, SBUX all sit roughly on the trend line for their respective growth rates. BROS, at the highest 2027 sales growth in the cohort (~23%), should trade at ~30-35x by the regression's prediction. Instead, it trades at ~20x — the largest negative residual visible. This is not a 'two stocks are both expensive' argument; this is the empirical observation that BROS uniquely fails to receive the multiple its growth profile commands. Mean-reversion to the regression line implies a fair multiple of 30-35x, vs. my base case of 28x
IV. Risks to the Thesis
■ SSS deceleration below 3% (most significant near-term risk). 2026 guidance of 3-5% laps a strong 2025 base. Any quarter where transactions turn negative would signal demand deterioration and trigger multiple compression to the 20-22x range, implying ~30% downside. I am watching Q1 2026 (May 6) as the most important data point.
■ Direct format competition with 7 Brew, Scooter's, and Black Rock. As format peers scale into BROS's geographies (TX, OK, AR, TN), the 'first specialty drive-thru in town' advantage erodes and the differentiation gap with the broader category narrows. 7 Brew has already added 200+ locations in 24 months. The risk is not that any single competitor wins — it is that the overall specialty beverage category becomes more crowded, putting downward pressure on traffic and pricing.
■ Food margin dilution and throughput degradation. Food COGS (estimated 35-45%) is structurally higher than beverage COGS (25-30%). Critically, drive-thru speed is BROS's core value proposition — if food preparation slows order completion times during peak periods, the unit-level damage exceeds the food revenue benefit.
■ Category convergence (China-style boundary blurring). In China, traditional boba/tea chains expanded into coffee while coffee chains pushed into fruit teas — boundaries dissolved and competition intensified for all participants. The same pattern is emerging in the US: McDonald's testing boba and Refreshers, Taco Bell launching Refrescas. The wallet share for 'fun beverages' is finite and US consumers face more substitutes every year.
■ Coffee commodity exposure. Coffee futures of $3.30-3.80/lb for 2026 are favorable vs. ~$4 in 2025, but coffee is volatile. Any Brazilian weather event or supply disruption could re-introduce 100+ bps of COGS pressure.
■ Share dilution. Share count grew 20.8% YoY due to OpCo Class C → Class A unit conversions. This is mostly mechanical but creates a structural per-share growth headwind. EPS growth must materially outpace share count growth for the equity story to compound.
■ Execution at scale. Reaching 2,029 stores by 2029 requires 200+/year sustained for four years — a pace BROS has not yet executed. Cultural dilution is the single hardest thing to scale in a service-led business; this is the longest duration risk.
Conclusion
BROS represents one of the cleanest unit-growth stories in the public restaurant universe today: 1,136 stores in a 7,000+ store TAM, $2.1M AUVs that exceed Starbucks despite operating at one-third the square footage, leading store-level ROIC (34%) and the shortest payback period (2.9 years) in the franchised coffee peer set, and five consecutive quarters of traffic-led same-store sales growth in a macro where most QSR peers are flat-to-negative. The growth-adjusted regression places BROS as the most undervalued name in the QSR universe — 12-14x below its implied multiple. Recommendation: LONG with a 12-month price target of $82, implying +43% upside in the base case and a +36% probability-weighted return after accounting for the bear scenario.